How to derive expected velocity from strategic dates
The contrast between ideal and real is powerful. Makes you focus.
By not paying enough attention to the gap between the ideal and real, you may end up with a complete blowout like Fyre Festival founder McFarland. I heard of it only long after it happened by watching the Netflix documentary. Clearly I’m not the brightest in terms of social media usage.
The biggest takeaway from the Neflix documentary I had was around McFarland’s unwillingness to face the operational realities of what he was promising. Which ultimately led to his downfall. He kept pushing back on anyone who brought him bad news, telling them to “stop being negative” or just firing them. If he had taken in the feedback earlier, he and his team could have avoided the whole blowup.
I’ve found a simple tool to help straddle the vision with operational reality.
I first heard of it from a relatively older book called Lean Thinking by Womack and Jones. Basically, it should be possible to measure what the average output rate should be in order to meet customer (or executive sponsor) expectations. They call this takt time. The term originated in Germany in the 1930s, and was basically used as an output “pulse” benchmark.
The example they used was that of a bicycle factory. In short, “takt time synchronizes the rate of production to the rate of sales to customers”, according to Womack and Jones.
While initially bicycles were built in larger batches based on the orders coming in, this usually caused internal operational conflicts if multiple customers had expectations of delivery. Moreover, it usually took weeks to deliver anything. And usually the orders were late.

Instead, by figuring out that the average expected output rate was that of producing one bicycle every 10 minutes everything became much simpler. In effect, if the factory could guarantee a “pulse” of output at that rate, they would be certain to meet typical customer expectations. This required a significant change in the floor layout of the factory, upskilling employees to be more flexible, and change in production processes.
Here is a smaller scale example of the change in mindset of what needs to happen at the factory, in order to deliver to a takt time:

But ultimately they invested enough time and effort to get to the required level. Which meant that their customers always got the right number of bikes on time. Which was a big change from before.
How does this work?
Let’s say you need to deliver 59 orders of 192 bikes on average in a year.
takt time = available time / customer demand
= 235 business days / 40
= 3.98 days per order ~ 4 days
If the bikes are relatively similar across the board, you can reduce it to a much more granular per bike time:
4 business days/ 192 bikes
= 6 * 8 * 60 = 1920 minutes
So effectively to meet this level demand the factory needs to deliver 1 bike every 10 minutes. This is a pretty objective measure and one which is observed every 10 minutes, so there is a high frequency of potential observations. You’ll know pretty much in real-time whether that pace is being achieved or not, by looking at a well-placed stopwatch.
Obviously the aggregate volume of orders may increase or decrease over time, and takt time will need to be adjusted so that production is always synchronized with demand. The production slots created by the takt time calculation are clearly posted so everyone can see where production stands at every moment. This can be done with a simple whiteboard in the product team area at the final assembler, but will also involved electronic displays in the assembler firm and electronic transmission for display in the supplier and customer facilities as well. Womack and Jones in Lean Thinking
Once this number is calculated, you have a clear operational benchmark you need to hit. Most likely, you’ll need to change how you work, in order to make it possible to 100% complete one bicycle, if you are used to batching productions of approximately 200 units. But from a monitoring perspective, it becomes a powerful and objective way to know what is happening on the factory floor.
An even simpler example
Let’s say you’re running a hamburger stand for 4 hours a day.

What is the takt time for 50 customers? 75 customers?
Time available is 4 hours (240 minutes)
50 customers – takt time is 240 / 50 = 4.8 min
75 customers – takt time is 240 / 75 = 3.2 min
From a management perspective, you need to organize the process, system and people to deliver a hamburger within that time frame, if you want to be meeting demand as it comes in. In practice, these are averages and people might clump up and have a lot come at once, particularly if you are doing a good job. Having long queues can also be a marketing strategy. But from an operational standpoint, you have a pretty clear benchmark of how much time you have to service each customer.
The new technology case: B2B enterprise software example
In fact, with new technical products it’s relatively easy to know if your operational realities are misaligned with the same approach. Break down and contrast the expected velocity of a new product team with the rate at which they were going. (all assuming they’re building the right thing of course).
After significant deliberation for a few years, an executive team at a client finally had a view on what needs to built. There was a decent technical hypothesis for how it could work. On the market side, they decided that current clients are the best initial adopters, as they are likely to pay. But that meant the new product had to “hold water”. So we looked at de-risking the technical and delivery risk, since that was the biggest concern.
At this stage for the purposes of takt time, we were treating the project sponsors as one client, even though the product ultimately needed to be sold to a wider market. Together with around 10 experienced people, I was thrown in to figure out how to deliver on the big product vision by the given date. We started digging deeper into exactly what software needed to happen.
What actually needed to be built to fulfill the vision.
As frequently happens in these scenarios, the number of features to deliver on the vision was surprising. Or at least it even surprised me how much needs to be built before we got anywhere useful.
There was a gap between the wished for ideal and what was really possible:

We broke down the product vision into stories, and started estimating roughly how much work this would be.
The key variables here are:
- Story points: ye olde mesure of complexity and “cognitive load”
- Elapsed Time: both for values you expect and how long you are taking so far (if you’ve already started)
- Start and Release Dates: Start was obvious. Release date was given by the executive board.
Sizing the scope by numeric gut feel
At that point, we had hashed out all of the bits and pieces and important edge cases, that coming up with a range worked as an outcome.
Gut feel after a workshop is a good estimate, even if you don’t have all of the details handy. Without a workshop…sure I can come up with numbers and estimates, but probably not that useful.
- Start Date in this case was the next business day after workshop.
- Release date was given from upstairs.
- In terms of story points, to avoid giving the impression that this is a precise value because it’s a number, I like to provide a range. The range consists of a pessimistic (higher) and optimistic (lower) value. If I feel confident, the range will be narrower. And the opposite.
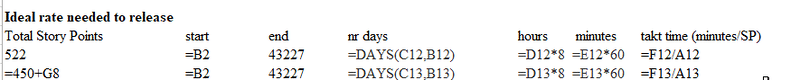
- Once you have the range, figure out the total number of minutes in between the start and end dates.
- Finally calculate what the implied pace is per story point. In other words, for each story point, how many minutes do you need to finish one on average (assuming the planned release date is fixed). This is called takt time in lean circles.
Case study
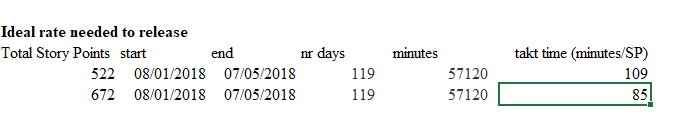
In the above case, we’ve got an expected takt time range between 85-109 minutes per story points. This is just an expression of either market or senior executive expectations. This analysis gives you something to contrast with what you actually observe on a continuous basis.
Simple stuff right?
Well, we were already a few sprints in at the point I’d done this analysis. Turned out we were clocking in at a cycle time of 174 minutes per story point. On average.
This type of contrast is enough to trigger a discussion. Certainly that’s what it did at the time. Ultimately, it became clear that a lot had to change if we really wanted to hit the desired dates. Or that they were just plain unrealistic. Which is fine as an outcome up front. It’s better to know that earlier to at least have the option of digging in a bit more.
In this case, we needed to improve our velocity 2.2-2.8x given both scope, date, and team composition were fixed, as we were already signficantly beyond that initial start date. And assuming that complexity estimate range in story points was accurate.
Takeaways
Of course this opened many exploratory discussion threads–in terms of what to change in the company and workflow. And how to change them. Primarily, though, it defined the scope needed as an outcome of a larger delivery system. This system was clearly inefficient. More importantly, it wasn’t up to senior stakeholder expectations.
Since we were able to highlight this pretty early, it gave us a much better work environment. Accountability become palpable. Because we were open about the unrealistic expectations before they crippled us. And objectively communicated what our current resourcing and capabilities would mean to business outcomes.
What I liked most about takt time was that it gave a clear performance benchmark for the entire team to work towards. And for me to help them get there. It helped prevent miscommunication, blame, guilt, and lots of other nonsense that would happen without this kind of an objective measure. And having a healthy and productive workplace is an ideal worth pursing in my eyes.

